If TSMC Wins, Does Taiwan Win? A Countdown Clock That Can Be Turned Back

The risk Taiwan most needs to identify ahead of time may arrive at the moment of our greatest success.
The countdown clock · Interactive dual-line chart · Early-warning dashboard · Turning the clock back
TSMC’s order books are full, AI chips are changing the world, and companies are building ever more factories overseas. All of this can be good news. But even as we celebrate, I want to ask a longer-range question: ten years from now, will the place where the next generation of technology first succeeds still be Taiwan?
Will the engineers who crack the hardest problems, the suppliers who iterate through trial and error together, and the new companies that turn research into products still be growing up here? Can this wave of prosperity become wages, learning, and entrepreneurial opportunity for the young?
If the answer is yes, global expansion will become an even greater source of Taiwanese strength. If the answer slowly blurs, then however handsome today’s share prices and profits look, they cannot answer for the Taiwan of ten years from now.
This is why I am proposing a “lost-decades countdown clock” for Taiwan. Its purpose is to call everyone to the same table while we still hold the advantages, the resources, and the choices. Like the public reminder the Doomsday Clock inspired: we look at the time in order to start acting, and we look at the risk in order to change the outcome together.
Note: the interactive charts below are currently labeled in Chinese; every key figure is explained in the English text.
The clock sets the end of 2030 and the end of 2035 as its first publicly reviewable checkpoints. The former gives policy a near-term delivery deadline; the latter preserves the five-to-ten-year horizon over which industrial capability accumulates. This is an action schedule I am proposing — no research can assert from it that “Taiwan’s lost decades will begin on that date.”
What we truly need to avoid is looking back one day and discovering that, back then, there was still time.
A Company Goes Global — Where Does a Place Go?
Companies go abroad to serve customers, diversify risk, capture subsidies, recruit talent, or keep their access to markets. Every one of these business reasons deserves to be understood seriously.
At the same time, a firm’s globally optimal choice and Taiwanese society’s optimal choice do not necessarily coincide. Two objective functions state the problem precisely:
is how production, R&D, and the supply chain are configured. The left side cares about the firm’s global value; the right side must also care about real income earned inside Taiwan, frontier capability, technology spillovers, and resilience. This is the starting point for analysis, not a declaration that the two must conflict.
TSMC can win everywhere in the world; Taiwan still needs a set of policies that keeps those victories flowing back home.
Who owns the company, where capability resides, and to whom income accrues are three interrelated maps that must never be used interchangeably.
This also explains why “profits are excellent right now” cannot close the discussion. TSMC’s 67.7% gross margin in the second quarter of 2026 shows the company remains formidably competitive today; it does not directly answer how much R&D, learning, and value added will happen in Taiwan ten years from now. Earnings release
The dashboard deliberately separates “observed,” “in progress,” and “not yet substantiated.” That capital flows have shifted does not automatically light up the other five panels; and thin data in any one panel must not be taken as an all-clear. What it tells us is where the next piece of evidence worth obtaining lies.
When the Two Lines Pull Apart, Start Asking Questions
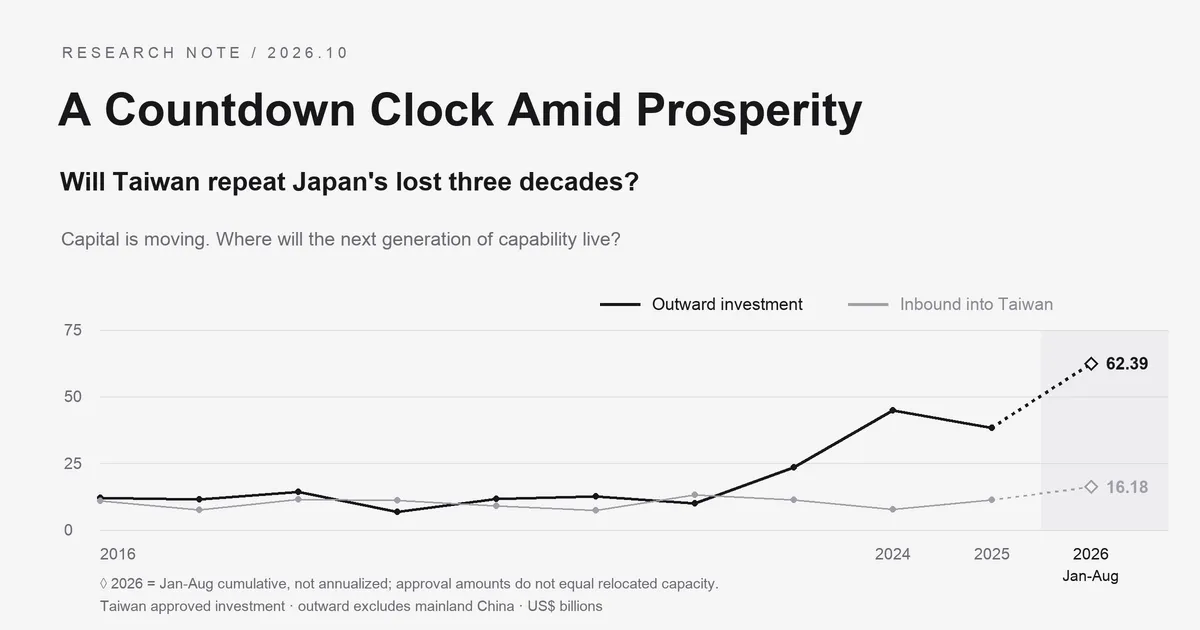
Begin with a new signal that must not be missed: only eight months into 2026, approved outbound investment has already reached US$62.39 billion — more than the US$44.932 billion for all of 2024, and more than the US$38.432 billion for all of 2025. Approved inbound investment from overseas Chinese and foreign investors over the same period was US$16.181 billion. Ministry of Economic Affairs release for January–August 2026
The 2025 pullback is real too: approved outbound investment announced by the Ministry of Economic Affairs fell 14.47% from 2024. But a chart that stops there misses the expansion 2026 has already put on the record. That the year is not over does not mean the cumulative amounts already booked should stay off the chart. The chart below defaults to approved investment and brings in 2026 with a diamond marker, a dotted line, and an explicit cumulative period; all amounts are plotted at original value, never annualized, and gaps between unequal periods are never described as same-period annual growth. Full-year 2025 release
But this approval curve cannot simply be renamed a “capacity offshoring curve.” It includes fab construction, but also holding companies, M&A, and financial transactions; whether the total rises or falls, you must first unpack purpose and approval timing before judging what has happened to industrial capability.
Now look through a different statistical lens — actual transactions. The central bank’s balance-of-payments data show that Taiwan’s direct investment assets rose by US$45.37 billion in 2025 while direct investment liabilities rose by US$11.026 billion, a gap of US$34.344 billion. The comparable gap in 2023 was US$18.259 billion. Central bank raw data
The “net outflow” here has a very simple definition:
is the increase in direct investment assets, the increase in direct investment liabilities; both are net transactions in the statistical sense, and both may include reinvested earnings and intercompany debt. It is not a receipt for “cash moved out of Taiwan,” still less the whole of cross-border capital flows. But a widening gap is reason enough to demand answers: where did the investment go, what is it building, and how does it affect what happens inside Taiwan?
The chart can switch between Japan and Taiwan, and can index each series to 100 at its own starting point so you can study the shape of the net-outflow curve:
This is a ruler for comparing trajectories, nothing more. It cannot make different eras, economy sizes, exchange rates, and statistical systems equivalent, and it does not convert the resemblance between two lines into a probability of crisis. Japan’s 1995 statistical break is kept visible on the chart; the years Taiwan has not yet lived through are left blank.
Approval statistics answer a different question: which investments have been administratively cleared. Of the January–August 2026 outbound total, TSMC’s US$30 billion capital injection into its British Virgin Islands holding company and its US$20 billion injection in Arizona together account for roughly 80%; on the inbound side there is also Micron’s large debt-to-equity conversion through its Singapore entity. Ministry of Economic Affairs explanation
These details do not dissolve the concern, but they do tell us how to investigate: trace from the immediate place of registration all the way to final use. A one-layer injection into a holding company and the fab construction downstream of it must not be counted as two tranches of new capacity; a debt-to-equity swap is not the same as an equal amount of new cash in the current period.
Did Tariffs Make Everyone Stop in 2025?
It is an intuition worth checking. Surveys by the National Development Council and CIER do record firms in wait-and-see mode: manufacturing PMI fell to 48.9 in April 2025 and was still only 47.9 in August, with firms waiting out tariff negotiations, Section 232, and the reaction of end demand. There is contemporaneous evidence that tariff uncertainty weighed on business confidence; how much of the full-year decline in approvals it caused cannot be computed from these data. April survey | August survey
Splitting the year into twelve months reveals another factor that cannot be ignored. Approvals totaled US$11.068 billion in March and US$11.59 billion in August — and each month contains a US$10 billion capital injection by TSMC into TSMC Global, its British Virgin Islands entity. The official documents state that both were made to lower foreign-exchange hedging costs and to earn interest on bank deposits and bond investments. Together they come to US$20 billion, roughly 52% of the full-year US$38.432 billion, and they cannot be counted as two overseas fab projects. March approval document | August approval document
So the apparent plunge from US$11.068 billion in March to US$1.248 billion in April does not mean tariffs suddenly froze overseas investment. Subtract only that identified US$10 billion March injection, and the remaining March approvals come to US$1.068 billion — lower than April’s total. This is merely a decomposition of how one large case shapes the curve, not a causal estimate of tariff effects; nor can the remainder be uniformly labeled physical investment. The chart above includes an expandable month-by-month approval table that preserves the original totals and the sources for both cases.
Year-over-year comparisons are likewise shaped by the mix of large cases and the prior year’s base. The approval month is neither the date a company decided nor the date it executed, and multi-year US investment announcements are not booked into approvals in the month they are announced. The more discriminating observation is this: in August business confidence was still weak, yet approvals hit their highest level of the year. “Some firms are waiting” and “large capital allocations are continuing” can both be true at once.
This essay therefore keeps 2025’s genuine decline and 2026’s already-published rise, without treating either turn as direct proof that industrial offshoring is accelerating or decelerating. What must be traced is how each investment travels toward plant, equipment, R&D, and talent — and whether new capability inside Taiwan is growing in step.
The Unspent Hundreds of Billions Are Already Shaping the Future
Looking only at last year and this year misses the most forward-looking part of this question.
TSMC’s investment plans for the United States grew from roughly US$12 billion in 2020 to US$165 billion in 2025; in July 2026, the US government announced another US$100 billion, bringing the total plan to US$265 billion. These are multi-year, mutually inclusive plan totals — each new announcement cannot be added again. TSMC 2025 announcement | 2026 US official announcement
The chart also preserves one political signal that is unconfirmed yet cannot be ignored: in a TIME interview on September 28, 2026, published October 1, Trump mentioned a Taiwanese chip company investing US$500 billion. His actual words named no company and gave no execution timeline. The figure therefore sits at the right of the chart in a dashed box under “2027+ forward watch” — a display position chosen for this essay, not a forecast or an officially committed year. It is not merged into the announced US$265 billion, nor counted in actual capital flows or capacity. The follow-up questions to press: is there a formal corporate announcement, a concrete project, and execution progress? Original TIME interview | INSIDE report
Beyond the growing dollar figures, the functional scope is expanding too: manufacturing, advanced packaging, and R&D team centers are entering the footprint together. That moves the policy question from “one overseas fab” to “a local cluster that can operate for the long term, accumulating talent and knowledge.”
That the commitments are not yet fully executed is precisely why forward-looking monitoring is needed. By the time land, equipment, talent, suppliers, and customer qualification are all in place, the discussion is no longer about whether to set out — it is about a path dependence that has already formed.
A research definition can express the distance between plan and capability:
is the set of announced projects; the probability each lands within the horizon; the effective new capability in a common unit. This essay fills in none of these numbers. Dollar commitments cannot stand in for capacity, and projected dates cannot stand in for volume production. Only by checking each project through announcement, approval, construction, tool-in, ramp, yield, and orders does estimating this expression become possible.
The same TSMC investor-conference materials also disclose 13 advanced process and packaging fabs planned in Taiwan. This current advantage must be part of the picture: overseas expansion and Taiwan expansion are happening at the same time. What policy must care about is what capability each side is adding — and where the next round of innovation begins. 2026 Q2 investor conference materials
Japan’s Story Must Not Stop Being Read at 1989
If Japan is to serve as a warning, then prosperity, capability transfer, shifts in competitive position, and the economic outcomes that followed must all be placed back on a sufficiently long timeline.
Samsung developed its 64Kb DRAM in 1983 and reached company-level DRAM leadership in 1992 — roughly nine years between the two milestones; South Korea as a nation took the DRAM top spot in 1998. These are historical sequences, not a law that “nine years after a transfer, decline follows.” Samsung official history | National Archives of Korea
The transfers of the 1990s mattered, then. Nan Ya Plastics signed with Japan’s OKI in 1994, and Nanya Technology, founded in 1995, carried the work forward; Toshiba licensed DRAM technology to Winbond in 1995, with further extensions afterward. All of this sat squarely inside Japan’s long passage from dominance to restructuring. Nanya corporate history | Toshiba 1995 announcement
History, however, also corrects stories that are too tidy. Samsung’s technology inflows involved America’s Micron and Japan’s Sharp; Taiwan’s path ran not only through Japanese DRAM licenses but also through ITRI, Philips, and the pure-play foundry model. And Samsung’s entry into DRAM in 1983 predates both the 1985 Plaza Accord and the 1986 US–Japan Semiconductor Agreement. Policies that came later cannot be written up as the cause of everything that changed earlier. Korea’s official industrial history | ITRI industry history
The most forceful reminder this history offers Taiwan is this: “we are still ahead today” and “somewhere else is beginning to accumulate the next round of competitive capability” can both be true at the same time. If the risk genuinely takes five to ten years to mature, then waiting until market share and profits visibly weaken before starting the research means missing exactly the window in which we are most able to adjust.
Put One Country Pair Back Into Three Sets of Relationships
Now pull the camera back: the Japan of that era faced the United States, South Korea, and Taiwan at once; the Taiwan of today competes with — and cooperates with — the United States, South Korea, and Japan at once.
Looking only at US–Japan and US–Taiwan tends to force the entire problem into the frame of “a large market demanding local production.” Add Japan–Korea and Taiwan–Korea, and you can examine how an independent competitor catches up; only with Japan–Taiwan and Taiwan–Japan can you see how technology, talent, and suppliers form a new capability base.
Start with the “expansion phase” view, then switch to the “dual-line overlay”: the Japan of then and the Taiwan of now on a single chart, showing the contour of accelerating capital movement — and showing clearly where the two lines diverge. We do not have to wait for Taiwan’s curve to finish before we act. Then press “what happened next” to see Japan’s post-1990 turn. The bursting bubble and the deteriorating US–Japan business cycle depressed investment back then, but falling capital flows did not mean the overseas manufacturing and commercial networks already built disappeared with them. Study of US–Japan economic and technology relations
The overlay fixes year 0 at Japan 1980 and Taiwan 2015, with each step one year; you can choose raw amounts, or each series indexed to 100 at its own start, sharing a single vertical axis — the peaks are never rescaled to coincide. This is a comparison for display, not an identified claim that both sit at the same point in the business cycle. Taiwan’s January–August 2026 figure enters at original value, not annualized, with subsequent unobserved years left blank. Where early Japan–Korea two-way data on a consistent basis do not exist, no curve is fabricated. What the chart raises is a warning that demands immediate testing — it does not compute that 2027 or 2030 is the year a bubble bursts.
If all three sets of relationships display the same mechanism — external incentives shift, investment and talent move, local capability accumulates, customers begin to have alternatives — the warning does indeed deserve more weight. The persuasive force comes from multiple links in the chain joining up, not from country names lining up neatly.
Nor can they be counted as three independent votes. The same wave of AI demand, subsidies, or geopolitical risk can drive all three sets of changes at once, and external ties such as US–Korea and US–Japan shape the outcomes as well. JASM belongs to TSMC’s own system, and Rapidus’s IBM partnership runs on a different track; they cannot all be flatly described as “Taiwan handing technology to Japan.”
I would test the analogy with stricter questions: can the local operation keep improving yield? Can it develop the next generation independently? Is it winning repeat orders? And do these changes simultaneously weaken Taiwan’s R&D, value added, or bargaining power?
The closer we get to these real outcomes, the stronger the warning. When all we see is capital moving, we should open an investigation; when we see the whole chain assembling step by step, policy needs to accelerate all the more.
We Are Still Growing — So How Could We Lose Relative Advantage?
This is the most easily overlooked point in the entire discussion.
A place’s capability can increase while its share declines. Suppose Taiwan’s effective capability in a given category grows from 100 to 120 while the comparable capability overseas grows from 100 to 180: Taiwan itself is up 20%, yet its share in the two-region model falls from 50% to 40%. Nothing inside Taiwan contracted; the relative concentration has already changed.
We should therefore watch two quantities at once:
The first is how much Taiwan itself improves; the second is how much of the world’s comparable capability remains in Taiwan. must be pinned to a product, a node, a yield, and a period; separate indicators for R&D or talent can be built as well, but different things must not be summed at will.
A falling share does not necessarily make life worse — it can accompany a growing market and rising incomes. What truly warrants heightened vigilance is whether a declining relative advantage goes on to depress local returns, innovation, and the formation of new industries. That question, the data must keep answering.
Try pressing “Taiwan accelerates, both regions at equal speed.” Overseas is never asked to stop growing, yet Taiwan’s share can hold steady. This is the scene I most want readers to see with their own hands: we can change our relative position through our own progress.
The model sets Taiwan’s starting share at , with domestic and overseas capability growing at annual rates and . After years:
When overseas grows faster and the starting point sits above a watch line of your own choosing, the time needed to fall to that line is:
The demonstration settings — a 70% starting share, a 50% watch line, Taiwan growing 5% a year, overseas growing 15% — work out to about 9.3 years. Every one of these parameters is an assumption, and 50% is not the threshold of lost decades. The formula explains exactly one thing: a small but persistent growth gap, compounded over many years, changes relative capability.
When domestic growth catches up with overseas growth and the starting point still sits above the watch line, this fixed-rate model never crosses the threshold downward. Reality is of course more complex than the model, but it makes the policy question concrete: what can we do to make Taiwan generate next-generation capability faster?
Between a Semiconductor Warning and Three Lost Decades Stands an Entire Bridge
The shift in Japan’s DRAM position cannot, on its own, explain Japan’s subsequent long stagnation. The asset bubble, bank balance sheets, credit, and productivity all have to enter the analysis. Bank of Japan research
Taiwan likewise needs to connect the industry level to households and the economy as a whole. Is productivity outside semiconductors rising? Can young people’s real incomes keep pace? Is it getting easier to start a new company? Is financial capital supporting new industries, or concentrating ever more in a handful of assets and incumbent firms?
This is why the dashboard tracks all the way down to income and macro feedback. One can define the share of value added Taiwan captures within a given product chain:
It forces us to ask “where does the newly added value stay,” rather than adding revenue, wages, taxes, and share prices into one impressive but double-counted total. A firm’s global profits matter; how local income forms must also be examined on its own.
What evidence would lower my alert level? Overseas expansion accompanied by continued growth in Taiwan’s frontier R&D, effective capacity, real incomes, and new firms — with Taiwan still leading the next technology generation. What would raise it? Persistent weakening in new domestic investment, first-time volume production and core talent moving away, customers acquiring mature alternatives — compounded by deteriorating productivity and incomes.
This argument should accept correction from good news, and it should also be able to recognize bad news as it accumulates. A crisis clock that only moves forward and can never be set back cannot help us judge whether policy is working.
Turning Prosperity Into the Starting Conditions for the Next Decade
Taiwan’s advantages are still large — which is exactly why the question deserves to be asked deeply now. Rather than treating every overseas investment as a loss, or every record profit as a permanent guarantee, I would rather we produce verifiable answers to “how does global success convert into domestic capability?”
Research conditions, reliable energy and infrastructure, a living environment that keeps talent, supplier upgrading, and new industries in AI, software, and robotics can all become concrete workstreams. Overseas cooperation can also bring back markets, technology, and opportunities; negotiations and policy should spell out those returns clearly, not merely compare announcement totals.
The executive branch can take charge of data and foundational conditions; the legislature can demand public review and cross-ministry coordination; companies and research institutions can state plainly where capability-building is obstructed. And society can jointly insist that every round of growth gives more people in Taiwan the opportunity to take part in the next one.
This is a research direction worth digging into — and a public agenda that can begin now. We do not need to be fully certain about the future before preparing for it.
TSMC winning is a vital asset for Taiwan. Keeping Taiwan winning is our common work.I hope that when we look back years from now, the most valuable outcome of this clock will be that the risks it warned of never became Taiwan’s fate.
What most deserves protecting about the “sacred mountain that guards the nation” is Taiwan’s ability to keep creating the next mountain.
For Those Who Want to Dig Deeper: Data and Methods
The snapshot of annual and 2026 cumulative data was taken on 2026-10-04; on 2026-10-05, the 2025 monthly data, the two financially motivated capital injections, and the survey evidence on tariff-related wait-and-see were cross-checked, and Trump’s US$500 billion remark was placed separately as an unconfirmed forward watch item. The original annual totals were not rewritten; purposes and causal interpretations were corrected. In the DRAM history chart, solid and dashed lines connect only existing reference points, with no interpolation of missing years; Korea’s 1986 “below 5%” is not converted into a precise point value. This essay is the full forward-looking version — “full” meaning the argument, data definitions, interactive tools, and research limits are presented together, not a claim that every historical series is complete. The charts use fixed snapshots; only the calendar countdown updates with device time.
The Taiwan totals chart and the bilateral charts include 2026 cumulative values: Ministry of Economic Affairs approvals for January–August, central bank balance of payments for January–June. 2015–2025 are full years; partial years are marked with diamonds, dotted lines, and their periods, plotted at original value and not annualized. In the cross-era index chart, the relative position of Taiwan’s 2026 first half and Japan’s full-year data must still be read separately. Japan’s totals cover 1983–2000; the bilateral history covers 1975–2000. Japan’s totals use JETRO balance-of-payments calendar-year data, with no fiscal-year notification tables spliced in. Reverse-direction Japan–Korea data before 1995 and a complete year-by-year DRAM market-share series remain missing.
The two eras have observation windows of different lengths. Japan’s outcomes have already happened; Taiwan’s have not yet been observed — and this affects any judgment about lags and similarity. This essay reports no crisis probabilities, no arbitrarily weighted country risk scores, no causal correlation coefficients, and no projections of Taiwan’s market share extrapolated from four historical reference points.
| What to verify | Primary data / research | Limits of use |
|---|---|---|
| Taiwan’s actual direct investment | Central bank quarterly open data, Central bank explanation | Asset/liability principle; includes reinvested earnings and debt |
| Taiwan approvals and bilateral investment | Outbound tables, Inbound tables, Full-year 2025, January–August 2026 | Approval ≠ execution; immediate place of registration ≠ final use |
| Japan annual totals and late Japan–Korea | JETRO long-run two-way direct investment | Balance of payments, calendar years; not strictly continuous across 1995 |
| Japan–US two-way | BEA foreign direct investment in the US, US direct investment abroad, 1950–1979 historical tables | All-industry financial transactions; historical vintage differences preserved |
| Japan’s early notifications to Korea | Korea Ministry of Trade, Industry and Energy tables, 1962–2025, Japan–Korea joint study | Not directly spliced with Japan’s fiscal-year notifications or BOP |
| DRAM historical benchmarks | Semiconductor History Museum of Japan | Four-year approximations; company nationality, not manufacturing location |
| Korea’s catch-up | Samsung history, official industrial history, National Archives of Korea | Company-level firsts kept separate from national firsts |
| Japan-to-Taiwan technology transfer | Toshiba/Winbond 1995, Nanya corporate history, Nanya/IBM 1998 | Not all technology sources attributed to Japan |
| Origins of Taiwan’s pure-play foundry model | ITRI industry history | Kept separate from the DRAM licensing path |
| Contemporary companies and footprints | TSMC 2026 Q2, investor conference materials, 2025 US plan, 2026 NIST announcement | Plans / construction / production kept separate; a company ≠ a territory’s share |
| Japan’s new entrant | Rapidus 2nm prototype announcement | A prototype is not conflated with the 2027 mass-production target as achieved |
| Trade regimes and macro background | 1986 Semiconductor Agreement statement, Bank of Japan bubble research | Industry change alone cannot explain long-run stagnation |
The next research most worth investing in uses product- and technology-level data to connect capital, talent, effective capacity, repeat orders, and domestic value added — and then tests the direction of causality against other countries and industries as comparisons. The value of a historical analogy lies in posing questions that can be tested.